Interpolating (hex) colour values
Interpolating between colours in a pandas dataframe
By Maurits van der Veen in python colours
February 2, 2022
Abstract
In visualizations, it is often desirable to be able to display gradations of colour, or to interpolate from one colour to another.
When plotting data from a dataframe, we would like to be able to do this automatically from any one colour to any other colour. For instance, if we want to plot a number of distinct colours but want the transition from one to the next to be gradual.
This notebook shows how to do this easily and neatly (scroll to the bottom for a link to the actual .ipynb notebook).
1. Import modules
import matplotlib as mpl
import matplotlib.pyplot as plt
import numpy as np
import pandas as pd
2. Interpolation functions
Two functions handle the interpolation; both are built on/inspired by very helpful Stack Overflow answers:
-
colorFader_arrayis an array-based version of Marcus Dutschke’s answer here: https://stackoverflow.com/questions/25668828/how-to-create-colour-gradient-in-python -
interpolate_hexcolor_dfis an adaptation of jdehesa’s answer here: https://stackoverflow.com/questions/41895857/creating-a-custom-interpolation-function-for-pandas
def colorFader_array(c1, c2, mix=0):
    """Fade (linear interpolate) from color c1 (at mix=0) to c2 (mix=1).

    Array-based version of Marcus Dutschke answer here:
    https://stackoverflow.com/questions/25668828/how-to-create-colour-gradient-in-python
    """
    return np.array([mpl.colors.to_hex((1-mix_i) * np.array(mpl.colors.to_rgb(c1_i)) \
                                       + mix_i * np.array(mpl.colors.to_rgb(c2_i))) \
                     for c1_i, c2_i, mix_i in zip(c1, c2, mix)])
def interpolate_hexcolor_df(df):
    """Take a dataframe with columns that are color values,
       with missing values (NaN) inbetween that are to be filled by interpolation.

    Interpolate by "averaging" the colors over the missing range.

    Inspired by the answer by jdehesa at
    https://stackoverflow.com/questions/41895857/creating-a-custom-interpolation-function-for-pandas
    """
    # Extract into numpy array
    vals = df.values.copy()

    # Produce a mask of the elements that are NaN
    empty = np.any(pd.isnull(vals), axis=1)

    # Positions of the valid values
    valid_loc = np.argwhere(~empty).squeeze(axis=-1)

    # Indices (e.g. time) of the valid values
    valid_index = df.index[valid_loc].values

    # Positions of the missing values
    empty_loc = np.argwhere(empty).squeeze(axis=-1)

    # Discard missing values before first or after last valid
    empty_loc = empty_loc[(empty_loc > valid_loc.min()) & (empty_loc < valid_loc.max())]

    # Index value for missing values
    empty_index = df.index[empty_loc].values

    # Get valid values to use as interpolation ends for each missing value
    interp_loc_end = np.searchsorted(valid_loc, empty_loc)
    interp_loc_start = interp_loc_end - 1

    # The indices (e.g. time) of the interpolation endpoints
    interp_t_start = valid_index[interp_loc_start]
    interp_t_end = valid_index[interp_loc_end]

    # The share of the distance between the two endpoints represented by each index location
    share_of_distance = (empty_index - interp_t_start)/(interp_t_end - interp_t_start)

    # Now apply to values, 1 column at a time
    newcolors = []
    valsT = vals.transpose()
    for column in valsT:

        # Select the valid values
        valid_vals = column[valid_loc]

        # These are the actual values of the interpolation ends
        interp_q_start = valid_vals[interp_loc_start]
        interp_q_end = valid_vals[interp_loc_end]

        newcolors.append(colorFader_array(interp_q_start, interp_q_end, mix=share_of_distance))

    newcolors = np.array(newcolors)
    newvals = newcolors.transpose()

    # Put the interpolated values into place
    interpolated_df = df.copy()
    interpolated_df.iloc[empty_loc] = newvals

    return interpolated_df
3. Application
To illustrate the process, we’ll create a df with some arbitrary colors, and create room to interpolate by adding blank intermediate rows.
# Pick some arbitrary colours
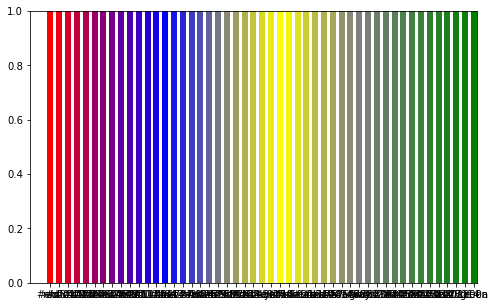
setofcolours1 = ['red', 'blue', 'yellow', 'gray', 'green']
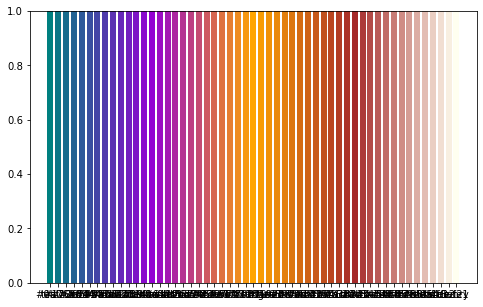
setofcolours2 = ['teal', 'darkviolet', 'orange', 'brown', 'ivory']
# Set up the data frame
df = pd.DataFrame(zip(setofcolours1, setofcolours2), columns=['colour1', 'colour2'])
# Create blank rows inbetween
emptyrowstoadd = 12
df.index = df.index * (emptyrowstoadd + 1)
new_index = range(df.index[-1] + 1)
df = df.reindex(new_index)
# Replace the NaN values with interpolated colours
newdf = interpolate_hexcolor_df(df)
4. Test
Draw simple plots to check that the interpolation worked.
fig, ax = plt.subplots(figsize=(8, 5))
for x in newdf['colour1']:
    ax.axvline(x, color=x, linewidth=6)
plt.show()
fig, ax = plt.subplots(figsize=(8, 5))
for x in newdf['colour2']:
    ax.axvline(x, color=x, linewidth=6)
plt.show()
Source
Click here for the .ipynb notebook corresponding to this post